 Trace Town
See your production system as a living city
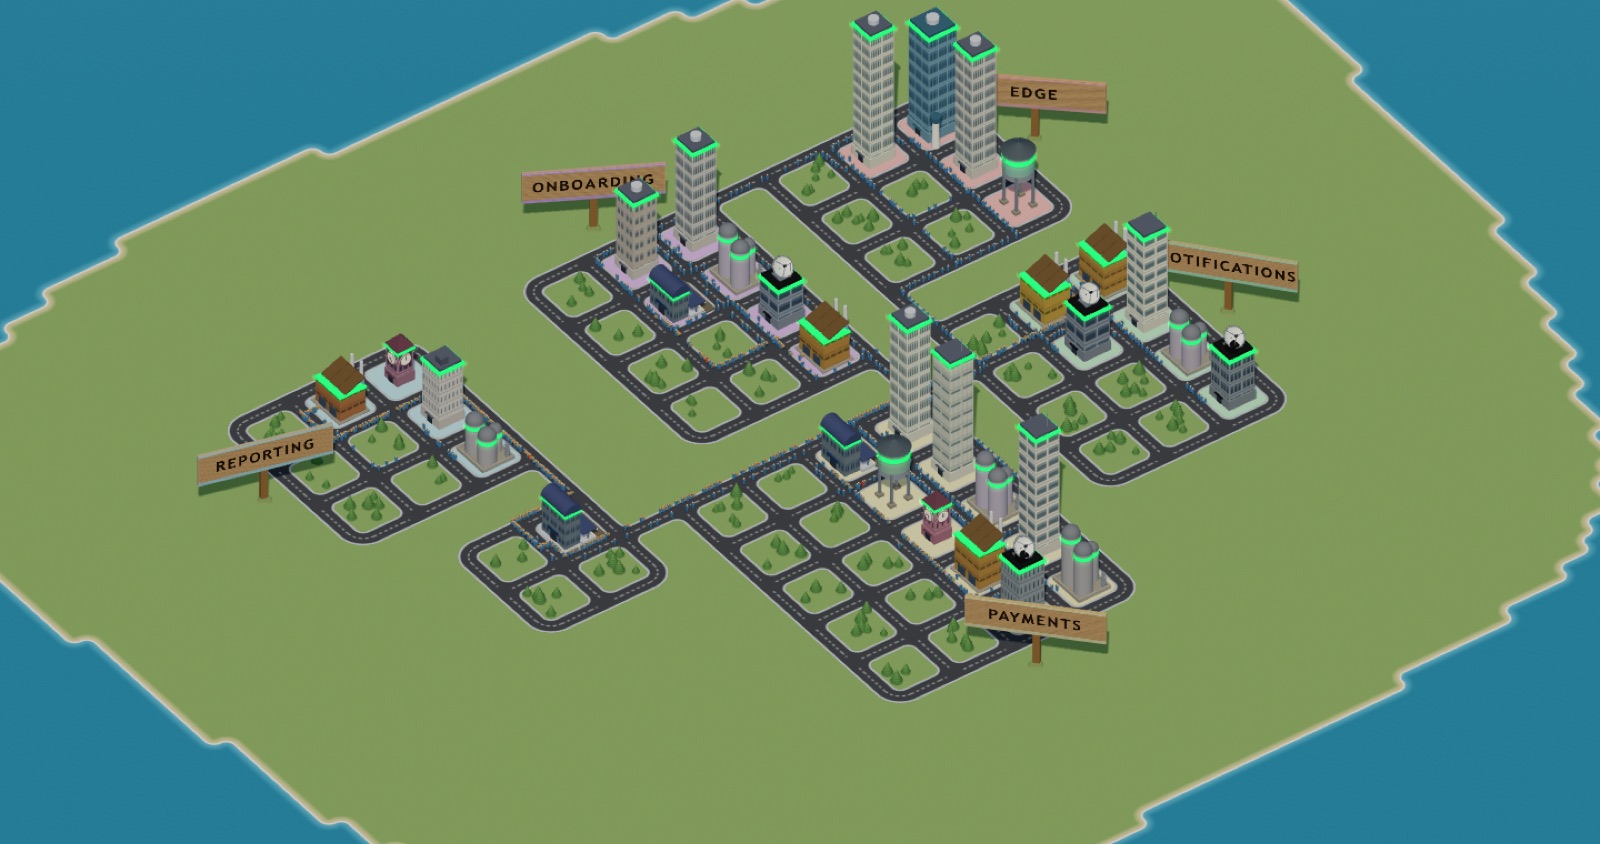
Services are buildings. Calls are roads. Traces are the traffic on them. Trace Town turns your telemetry into a place, so you can tell what your system is doing from across the room without reading a single number.
Runs in your browser on sample data. No sign-up, nothing to install.
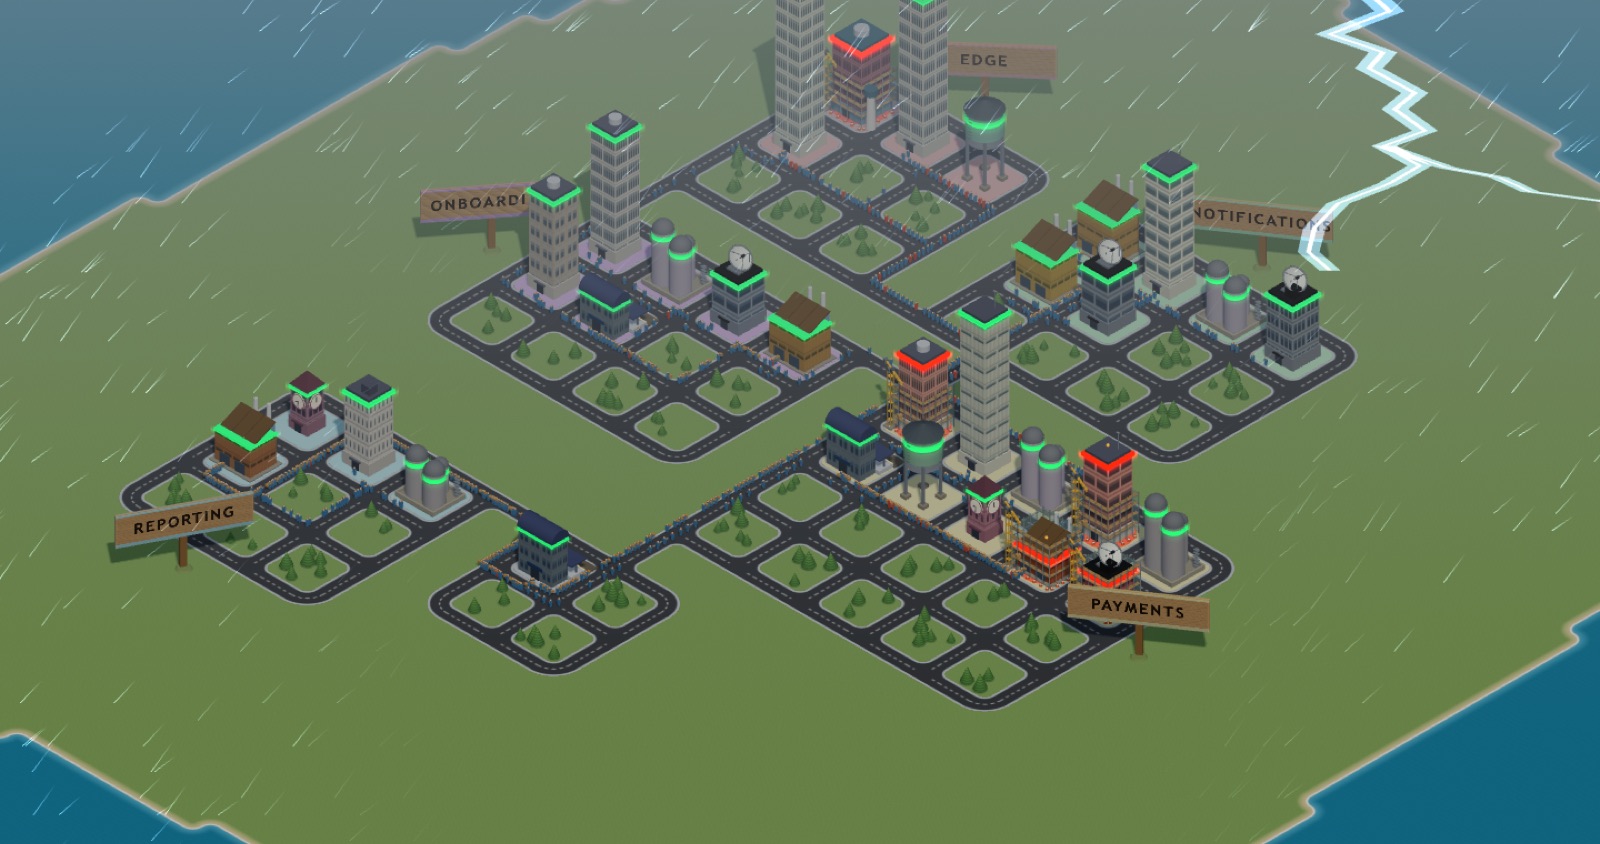
An incident looks like an incident
A dashboard makes you read numbers and infer state. A town expresses state as a place. A roofline that has gone red, a street with traffic backed up, scaffolding going up over a block, a sky turning to storm — you take all of it in at once, from the far side of the room, without reading anything.
Nothing here is decoration. Every one of those is a signal with exactly one meaning, and nothing else shares it.
What maps to what
Every signal has one visual meaning, and nothing else shares it.
The streets are your architecture
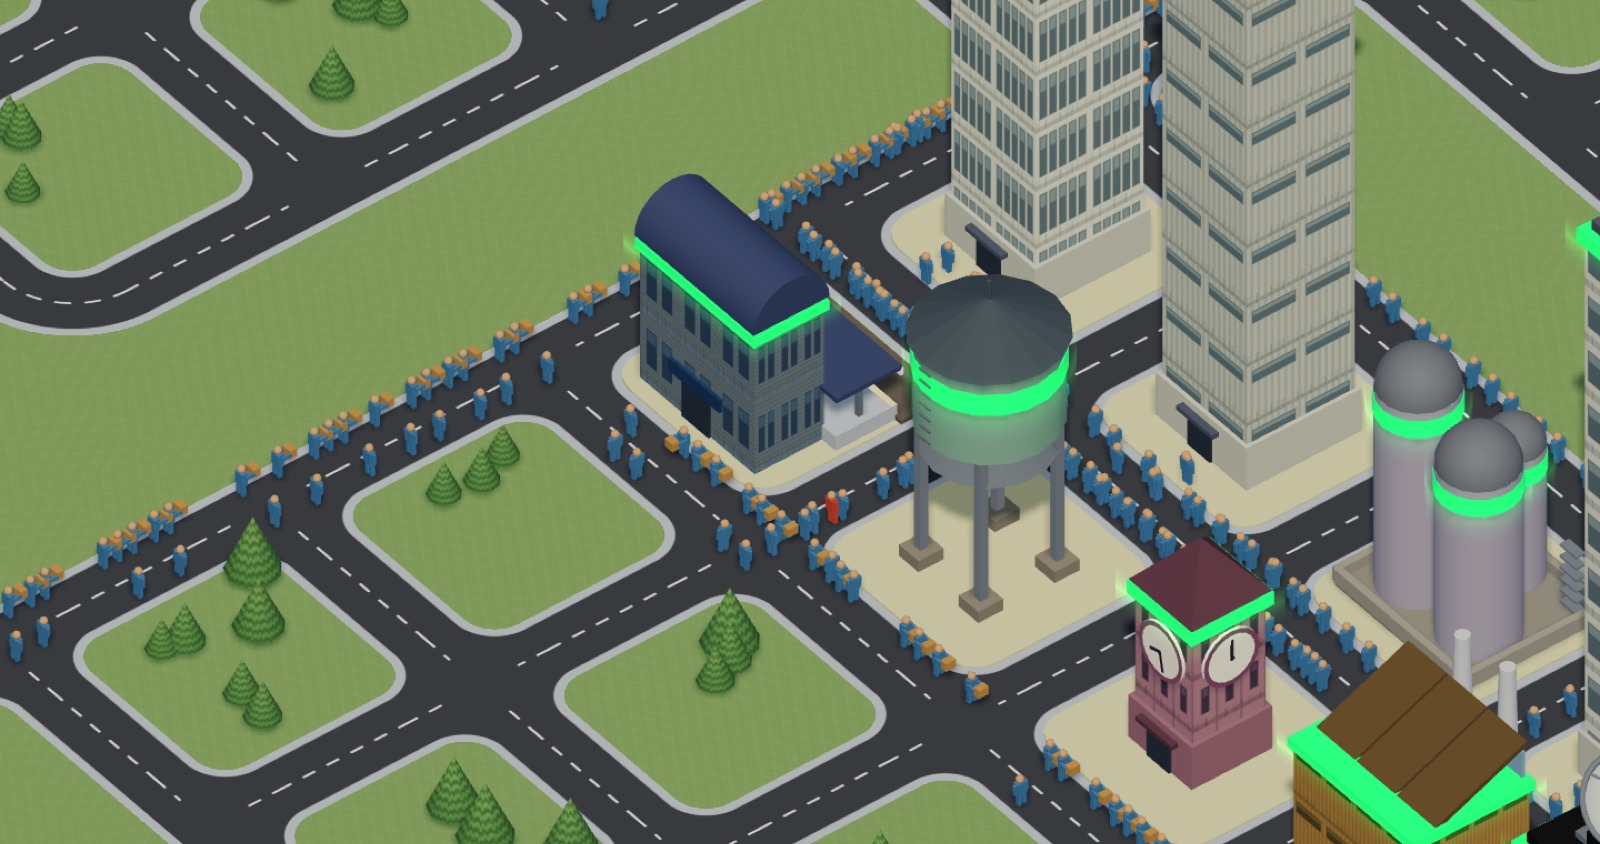
Roads only exist where something actually calls something. A district with one road in and one road out is well factored, because it is; a district with eight roads crossing its boundary looks like what it is. Nobody has to read a number to know which they are looking at.
Buildings tell you what a thing is before you read its name. A cache is a water tower, a database a tank farm, a queue a postal depot, a worker a factory, a cron job a clock tower, and a third party you don't run gets a satellite dish on the roof.
How it works
Trace Town reads the OpenTelemetry signals you already produce. Per-service request rate, error rate and latency give you the buildings; the service graph gives you the roads — so the town lays itself out from your real topology rather than a diagram somebody drew once and stopped updating.
Every backend reduces to one normalised snapshot, so the renderer neither knows nor cares where the data came from. Connect Prometheus — or anything Prometheus-compatible, which includes Grafana Cloud and Mimir — and it reads standard OpenTelemetry metrics with no vendor API and no proxy. SigNoz works too.
Your town, arranged your way
The layout seeds itself from the observed call graph, and you can rearrange it: drag a building onto any block and the roads re-route as you go. Zone the town by call graph, by building type, or by your own domains — some teams want a database beside the service that uses it, others want every database together. Whatever you place by hand stays where you put it.